The approach for using surface plasmon resonance (SPR) as an optical method for detection of biomolecules with low concentration in real-time has been widely investigated. However, such instruments are highly expensive and bulky, hindering development for portable devices. After discussing with my professor Dr. Lin-Chi Chen about this project, I developed a simple and preliminary platform that can measure the refractive index change of a liquid using SPR.
Figure 1. Prism-based SPR detection
The prism-based SPR system (Fig. 1) is widely used in practical applications, including today’s instruments. Here, A p-polarized light source is refracted into a prism, totally internal reflected (TIR) on another side, and refracted out at another, being received by a light detector. Usually a fluid channel with a special treated surface (e.g. glass with evaporated Au) is placed on the top where the TIR effect happens.
Figure 2. Attenuated total reflection phenomenon (ATR).
When the light beam enters at a certain incidence angle, surface plasmon polaritons can be excited in a resonant manner at the TIR interface. This means there would be attenuated total reflectance (ATR) phenomenon at that angle, and a decrease of light intensity would exist (Fig. 2). This incidence angle is called the SPR angle, and has a linear relationship with the reflection index of the fluid-glass interface.
Hardware Design
Figure 3. Materials used in this project.
The materials used for constructing this platform are in Fig. 3. As the light emits from the laser, it passes through the convex lens to change its direction, ending up in a slightly diverging beam, entering the prism and hitting the chip surface at different incidence angles (Fig. 4).
Figure 4. Simulation of red light from a laser passing through a convex lens, a prism, and through a microfluidic chip.
The range of incidence angle (Θ) is calculated so that 62.294° < Θ < 72.203°, which at some value within this range there exists the SPR angle of water. Fig. 5 shows a few important specifications for the setup.
Figure 5. Specifications for materials using in this project.
Here’s a clip of the SPR phenomenon appearing at the upper region of the reflected light after an Au-evaporated glass slide is dropped with deionized water.
For detection of light signal, a photoresistor is fixed on a linear gear of the light detector holder. The position of the gear is controlled by a stepper motor fixed on the holder (Fig. 6). The totally internal reflected light will be captured by the moving photoresistor for recording light intensity at a certain position.
Figure 6. Light detection module consisting of a photoresistor, a linear gear, a stepper motor, and a 3D-printed holder.
Program Control and User Interface
Arduino is used for controlling the stepper motor and reading the output of the photoresistor. Prior to reading, the resistances are converted to voltage signals using a simple circuit. For developing a program with visual UI, processing language is used for communicating with Arduino. Fig. 7 shows the program consisting of a signal display panel and several buttons for different functions.
Here’s a demonstration of using the combined UI and hardware platform:
The program will record light intensity, and convert it to a signal with a range between 0 and 1000. In order to calculate the differential signal (the signal with SPR phenomenon minus the signal without SPR phenomenon), the program will average the signal being detected at a certain position within every cycle. By deleting the two averaged signals, this differential signal can be calculated. The differential can indicate the position that the ATR occurred.
Below is another clip for SPR detection using a microfluidic chip, the ATR can be clearly detected by the platform.
The direction of the speed of the linear gear will also have an impact on the signal. In Fig. 8, a smoother SPR curve (average difference of ΔV) is calculated by averaging the data obtained by the clockwise and counter-clockwise direction.
Figure 8. SPR Differential signal of light intensity converted to voltage including clockwise and counter-clockwise directions.
The total cost is a few thousand NTD, which is very low compared with commercial instruments (~1 million NTD). In the future, I hope that this platform can be reinforced for detecting bio-samples in real-time.
The minimization of instruments and relevant devices for data acquisition is a major demand for portable bio-sensing systems. In the following paragraphs, the development of real-time impedance detection systems is detailed, where generations α and β are developed. Generation α serves as the proof-of-concept for the construction of a detection system that can measure impedance from 0.1 to 10000 Hz. Generation β improves several features of generation α, such as the applied frequency range, measured impedance range, detection time, and detection repeatability. In generation β, a website is constructed for controlling the system and acquiring real-time data so that any remote user can have access using smart devices without the need for installing any apps or services. This is particularly useful regarding portability and accessibility, which is highly competitive for integrated biosensors concerning the internet of things (IoT) technologies.
Scheme for Generation α
The general scheme for this generation is depicted in Fig. 1. A function generator is used for producing sine voltage waves across a symmetric electrode system, then a NIDAQ device (USB-6210) is used for collecting voltage signals from the measurement circuit. The signal is processed and sent to a computer for data analysis and plotting.
Figure 1. General scheme for real-time impedimetric detection system (generation α).
Data Analysis using LabVIEW for Generation α
The block diagram and front panel of the LabVIEW data analysis procedure are depicted in Fig. 2. Two signals are acquired by the DAQ device: the input voltage and the amplified current (measured in voltages) of the electrode chip. When the amplification ratio of the current is known, the current can be calculated by dividing the measured voltage with the known ratio. The frequency is calculated using Fourier transform of the signals. The absolute impedance (|Z|) is calculated by dividing the amplitude of the input voltage by the current. The phase angle can be found by calculating the phase difference between the two signals. These two values are plotted on the graph in the front panel and can be saved as comma-separated values (.csv) that can be used for data fitting.
Figure 2. (a) Control panel and (b) block diagram for impedance measurement of Z_GENα using DAQ device and LabVIEW software.
Figure 3. A photo of the whole system of generation α.
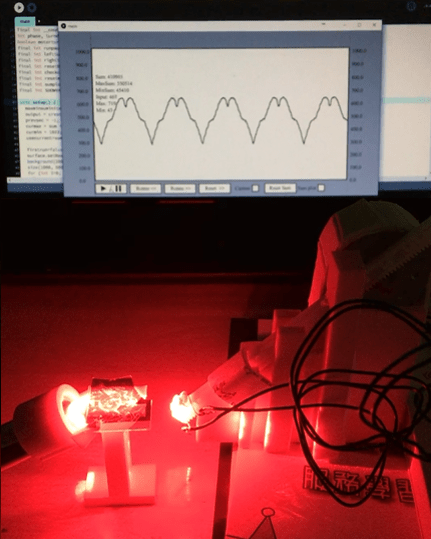
The clip below shows real-time impedance measurement using generation α. A microfluidic interdigitated array (IDA) chip (wg/we = 25/100μm, where we is the electrode bandwidth and wg is the gap width) is used. The flow rate is 0.1μL/s and the applied frequency is 100Hz.
A major difference between the detection of phase angle of generation β and that of generation α is that the former always output a sinusoidal wave from a phase angle of 0°, while the latter outputs from an arbitrary angle. By recording the time of the start of detection, the phase angle can be obtained by only measuring the output current wave. For instance, if the peak of a current wave is detected at the start of detection, then it can be deduced that the phase angle is -90° (Fig. 4).
Figure 4. A current wave of phase angle -90°.
In this generation, a miniaturized, portable, real-time, low-cost and remote commandable (website-based) system is developed. The target set for it has a whole list of goals in addition to the main features of a typical impedance analyzer: miniaturization, portable, real-time, low-cost and user-friendly. For the hardware, a Raspberry Pi 3 b+ model, an impedance measurement circuit, and a microelectrode sensor chip are integrated. The scheme of generation β is illustrated in Fig. 5.
Figure 5. General scheme for real-time impedimetric detection system (generation β).
Impedance Measurement Circuit Design
For generation β, several IC chips are integrated on a universal PCB board for achieving the functions of the function generator and the DAQ device in generation α. The AD9833 waveform generator is used for the production of sinusoidal voltage waves. TL074op-amps are used for transformation of electric signals. The fast precision op-amp OP42 is used for amplification of the small signal current running through the sensor chip. A voltage stabilizer module made from UA741 op-amp is used for providing stable voltage signal. The analog-to-digital converterAD7822 is used for signal acquisition, and sending digital signals to Raspberry Pi (Fig. 6).
Figure 6. Circuit schematic for generation β.
Data Processing
The raw signal obtained by the ADC is an 8-bit resolution data ranging from 0 to 255 at a rate of 1MS/s (mega samples per second). Due to the relatively fast sampling speed by Raspberry Pi and some imperfections within the circuitry, there may appear to be some defects or noisy signal in the acquired data. Thus, a strategy for data processing before the calculation of |Z| and phase of the measured system is designed. The general concept is depicted in Fig. 7 for a raw signal with a linearly transformed value between 0 and 1.
Figure 7. Strategy for impedance range detection and data processing for generation β.
First, leading and ending consecutive zeros are trimmed, and the data is shifted to a start of a non-zero value. Second, values outside n standard deviations from the average of m data points are removed where n and m are arbitrarily defined constants for a specific sampling frequency. Third, the removed values are linearly bridged between non-removed values to form continuous data points. Fourth, smoothing is performed by averaging k data points to form a new value. |Z| is found by calculating the standard deviation of the overall data which equals the zero-mean root-mean square (RMS) of the signal and is proportional to the amplitude with a relationship of . The phase is obtained by first calculating the average of the remainder of the time (μs) of a data point, which is larger than or equals the mean and its previous data point is smaller than the mean, divided by the number of data points within a repeating sine wave cycle, then linearly transforming it to a value between 0 and 360 degrees.
Website Server
For portable devices dedicated to point-of-care applications, a miniaturized device must be set up that contains user-friendly interfaces and well-designed data display graphics. A smart phone might come in handy when it comes to the such integration. Applications using smart phone for electrochemical on-chip detection of biomarkers are presented and published every year. For the above reasons, a website platform for the user interface of generation β is set as a target for its improvement compared with generation α, which can be accessed using local networking on either a personal computer, a smart phone, a pad … etc. The overall structure is shown in Fig. 8.
Figure 8. Structure of the web server of generation β.
Results for Generation β
The photograph of generation β is shown in Fig. 9. The dimension is 22(L)×10(W)×6(H) cm3, which makes it a portable system. The Raspberry Pi controls the circuitry by sending voltage signals towards the IC chips. The sinusoidal current passes through the sensor chip, gets amplified, then is sampled by the ADC. The transformed digital values are read by the Raspberry Pi and being processed. At last, impedance values are plotted on the website.
Figure 9. Photograph of generation β.
The content below is a clip for demonstration of using the website interface of generation β. The website shows |Z| vs f, phase vs f, Im(Z) vs Re(Z), Re(Z) vs f and –Im(Z) vs f at the same time. The collected data can be saved to a CSV file for further analysis.
A mobile power supply can be simultaneously used as the power supply for the circuitry and Raspberry Pi (Fig. 10), and smartphone-controlled impedance detection can also be achieved (also shown in clip below).
Figure 10. Generation β powered by a power bank.
Microfluidic Impedimetric Detection using Interdigitated Au Electrode Chip
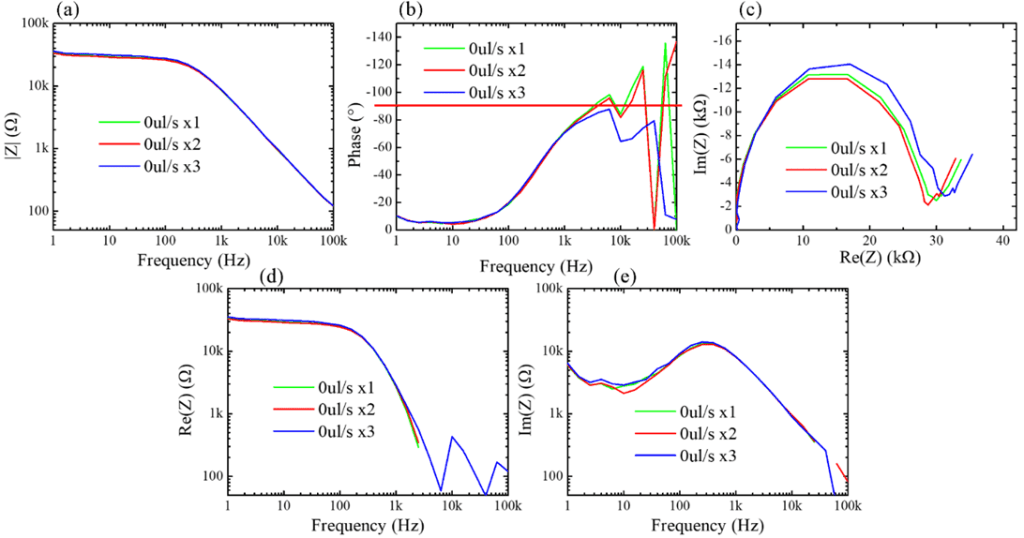
The repeatability of electrochemical impedance spectroscopy (EIS) detection in a microfluidic interdigitated array (IDA) chip system is tested using generation β as the measuring system. In Fig. 11, it can be seen that a fairly stable measurement of |Z| can be achieved within a frequency range of 1 ~ 105Hz, and an absolute impedance range of about 0.1 ~ 30kΩ can be detected. However, at high frequencies, the phase angle does not have a reasonable and repeatable value. This reason is due to the larger noise of sampling values at high frequencies. A red line is drawn at 90° on the phase vs f plot. Normally, phase angles wouldn’t exceed this value because that would give rise to a negative Re(Z), and does not correspond to any familiar electrochemical mechanism. Such sampling errors and data processing are needed to be improved.
Figure 11. (a) |Z| vs f, (b) phase vs f, (c) Im(Z) vs Re(Z), (d) Re(Z) vs f and (e) Im(Z) vs f for single EIS detection of IDA chip at 0μL/s flow speed using generation β. The channel width is 0.5mm. Vamp = 50mV. Running buffer: 5mM Fe(CN)63-/4-in PBS.