The approach for using surface plasmon resonance (SPR) as an optical method for detection of biomolecules with low concentration in real-time has been widely investigated. However, such instruments are highly expensive and bulky, hindering development for portable devices. After discussing with my professor Dr. Lin-Chi Chen about this project, I developed a simple and preliminary platform that can measure the refractive index change of a liquid using SPR.

Figure 1. Prism-based SPR detection
The prism-based SPR system (Fig. 1) is widely used in practical applications, including today’s instruments. Here, A p-polarized light source is refracted into a prism, totally internal reflected (TIR) on another side, and refracted out at another, being received by a light detector. Usually a fluid channel with a special treated surface (e.g. glass with evaporated Au) is placed on the top where the TIR effect happens.

Figure 2. Attenuated total reflection phenomenon (ATR).
When the light beam enters at a certain incidence angle, surface plasmon polaritons can be excited in a resonant manner at the TIR interface. This means there would be attenuated total reflectance (ATR) phenomenon at that angle, and a decrease of light intensity would exist (Fig. 2). This incidence angle is called the SPR angle, and has a linear relationship with the reflection index of the fluid-glass interface.
Hardware Design

Figure 3. Materials used in this project.
The materials used for constructing this platform are in Fig. 3. As the light emits from the laser, it passes through the convex lens to change its direction, ending up in a slightly diverging beam, entering the prism and hitting the chip surface at different incidence angles (Fig. 4).

Figure 4. Simulation of red light from a laser passing through a convex lens, a prism, and through a microfluidic chip.
The range of incidence angle (Θ) is calculated so that 62.294° < Θ < 72.203°, which at some value within this range there exists the SPR angle of water. Fig. 5 shows a few important specifications for the setup.

Figure 5. Specifications for materials using in this project.
Here’s a clip of the SPR phenomenon appearing at the upper region of the reflected light after an Au-evaporated glass slide is dropped with deionized water.
For detection of light signal, a photoresistor is fixed on a linear gear of the light detector holder. The position of the gear is controlled by a stepper motor fixed on the holder (Fig. 6). The totally internal reflected light will be captured by the moving photoresistor for recording light intensity at a certain position.

Figure 6. Light detection module consisting of a photoresistor, a linear gear, a stepper motor, and a 3D-printed holder.
Program Control and User Interface
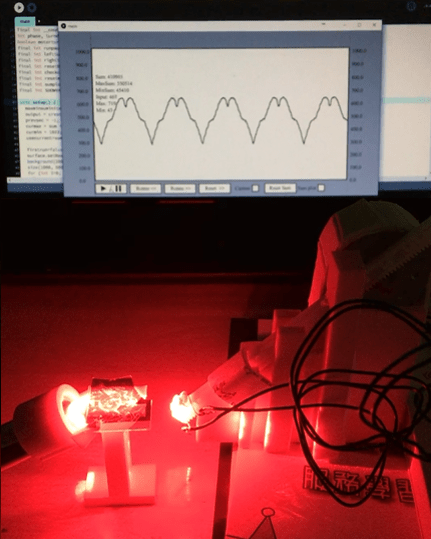
Arduino is used for controlling the stepper motor and reading the output of the photoresistor. Prior to reading, the resistances are converted to voltage signals using a simple circuit. For developing a program with visual UI, processing language is used for communicating with Arduino. Fig. 7 shows the program consisting of a signal display panel and several buttons for different functions.
[Source code for SPR platform control program]

Figure 7. User interface for SPR platform.
Here’s a demonstration of using the combined UI and hardware platform:
The program will record light intensity, and convert it to a signal with a range between 0 and 1000. In order to calculate the differential signal (the signal with SPR phenomenon minus the signal without SPR phenomenon), the program will average the signal being detected at a certain position within every cycle. By deleting the two averaged signals, this differential signal can be calculated. The differential can indicate the position that the ATR occurred.
Below is another clip for SPR detection using a microfluidic chip, the ATR can be clearly detected by the platform.
The direction of the speed of the linear gear will also have an impact on the signal. In Fig. 8, a smoother SPR curve (average difference of ΔV) is calculated by averaging the data obtained by the clockwise and counter-clockwise direction.

Figure 8. SPR Differential signal of light intensity converted to voltage including clockwise and counter-clockwise directions.
The total cost is a few thousand NTD, which is very low compared with commercial instruments (~1 million NTD). In the future, I hope that this platform can be reinforced for detecting bio-samples in real-time.