I have always wanted to automate the cumbersome experimental operation process. For biochemical experiments, often a whole day in web lab is spent in order just to acquire one single set of data. Having the hands-on experience of developing hardware and software integrated systems for several projects (e.g. Surface Plasmon Resonance Platform, Real-time Impedance Detection Systems), I initiated this project for constructing a microfluidic controlling platform that can automatically manipulate liquid-based solutions of little volume, and also assist real-time detection experiments.
Platform Structure
The platform is constructed by four sections: A Raspberry Pi, an actuator module that consists of an Arduino and two H-bridge circuits, a fluid controlling system made up of a syringe pump/syringe device, and the microfluidic platform (Fig. 1).

Figure 1. System architecture of the automated microfluidic controlling platform.
Here, the Raspberry Pi serves as the main processing unit, which an Apache web server is constructed on, and is used to communicate with a remote user by website. The front-end of the website is designed using HTML, Javascript and CSS, and the back-end is designed using PHP. Javascript and PHP communicate using jQuery, and the PHP code is written for controlling peripheral devices.
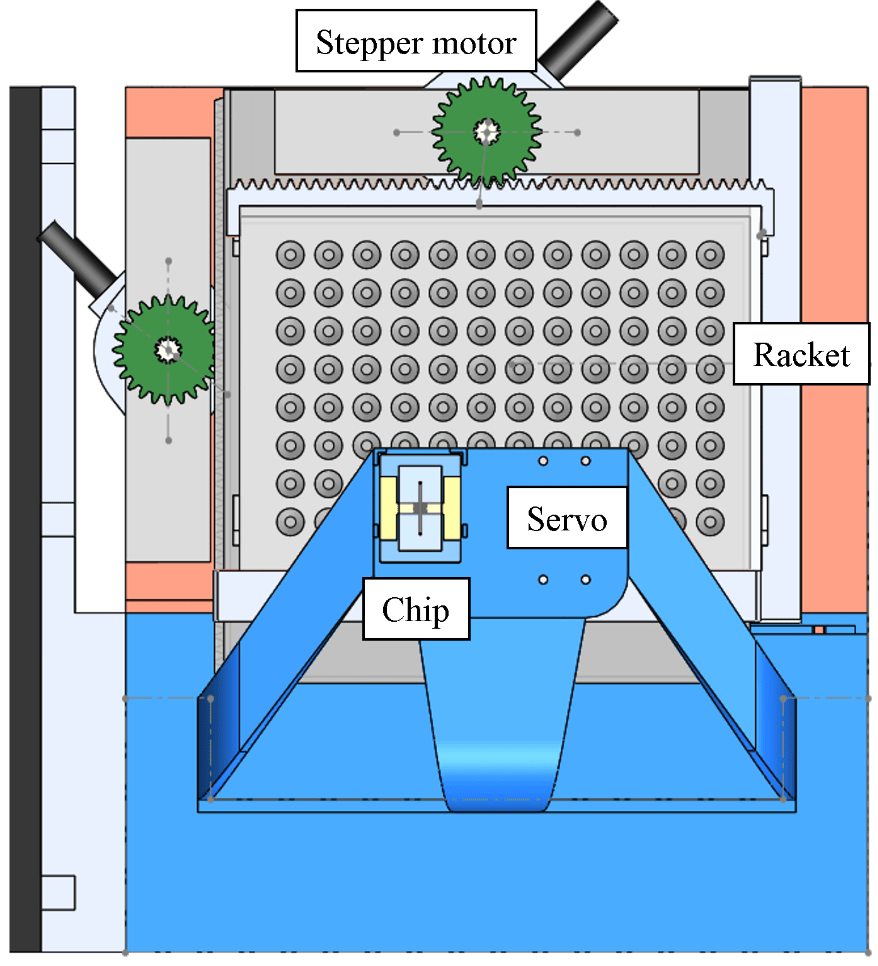
For x/y position control, the Raspberry Pi sends data through type-B USB to the Arduino, which afterwards commands the H-bridge circuits, then control the x/y stepper motors on the microfluidic platform for moving the position of the racket. The servo motor is used to control the high/low position of the tube it holds, where the high (low) position means the tube isn’t (is) inserted into the microtube (Fig. 2).

Figure 2. The microfluidic platform and surrounding modules.
For fluid control, the Raspberry Pi sends an infuse/withdraw signal to the syringe pump using another type-B USB, which subsequently pushes/pulls the syringe on it. A simple flow for moving liquid from microtube A to microtube B is:
1. Confirm that the tube (for fluid conveyance) position is high. If not, then move it up by servo motor.
2. Move to microtube A by stepper motor.
3. Change tube position to low by servo motor.
4. Withdraw liquid by syringe pump.
5. Change tube position to high by servo motor.
6. Move to microtube B by stepper motor.
7. Change tube position to low by servo motor.
8. Infuse liquid by syring pump.
Hardware Development
Fig. 3 shows a photograph of the whole platform. For the microcontrollers, Raspberry Pi 3 B+ and Arduino Uno are used. For the H-bridge, L298N dual driver module is used. Legato® 111 syringe pump (kd Scientific) and Series 700 Microliter syringe (Hamilton) are used for fluid control. HMS-25BY46L38 stepper motors and an SG90 servo motor are used for the microfluidic platform.

Figure 3. Photograph of the automated microfluidic controlling platform.
The circuitry for this platform is relatively easy compared with other projects (e.g. Aroma Alarm Clock), and is consisted simply with wires and resistors. Except the motors and the racket with microtubes, all the other components of the for microfluidic platform are fabricated using 3D printing. 3D-printed gears are fixed with the stepper motors. Precise control of racket position (~ 0.2mm) is realized by combining the gears with a 3D-printed linear gear that fits on the racket and another linear gear of a subsidiary platform which the racket sits on. Below is a clip demonstrating how the 3D-printed components, the stepper motors, the racket with microtubes, and a microfluidic electrode chip are integrated together, along with x/y position control of the racket.
Software Development
The program structure written inside Raspberry Pi is quite similar to the program structure in another project “Real-time Impedance Detection Systems”. The difference for this project is that PHP is used to directly communicate with peripheral devices (Fig. 1).
Fig. 4 displays the website-based user interface for controlling this platform. The UI is divided in four sections: procedure window, buttons field, racket window, and status window. Briefly, the user can save/load settings from the connected Arduino, add/delete a control command, start/pause/stop the current procedure, download the control procedure to a text file, and append a command after another one.

Figure 4. Website user interface of the platform.
Fig. 5 shows the settings menu. Here, the user needs to find the device url for Arduino and the syringe pump beforehand and insert them. Several controlling preferences, such as motor operation delay time, steps for the stepper motor to move per cell (microtube), precise high/low position of the servo motor, current cell of the racket … etc. can be set.

Figure 5. Settings menu of the UI.
Fig. 6 shows the add command menu. The user can either move the stepper motor to a target cell (microtube), infuse/withdraw fluid at a self-defined rate and target volume, move servo high/low position, or perform a time delay.

Figure 6. The add command menu of the UI.
Concentration Gradient Generation
An automated concentration gradient generation process is written, and is carried out by the automated platform. Here is a clip for demonstration (speed = 10x):
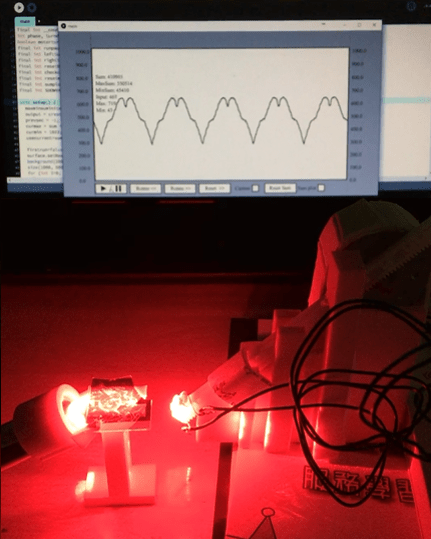
Real-time Impedimetric Detection
The tube doesn’t have to directly connect to a syringe. A detection chip can be inserted between for real-time detection of different solutions (similar to the method illustrated in Fig. 1 of another project Surface Plasmon Resonance Platform). A microfluidic interdigitated electrode chip using microfabrication technique is previously developed (which is a part of my research), and is used for detection of electrochemical impedimetric properties of the fluid. Here, potassium ferricyanide (K3Fe(CN)6) and potassium ferrocyanide (K4Fe(CN)6) are serial diluted using the platform, and real-time impedance detection is carried out using an electrochemical analyzer (CHI614b, CH Instruments) and the microfluidic chip.
Fig. 7 shows the detection result. It can be seen that the solution switching time is relatively fast and stable, and the detection time is consistent, which demonstrates the advantages of this automated platform.

Figure 7. Real-time impedimetric detection plot for different diluted concentrations of K3Fe(CN)6/K4Fe(CN)6.
Summary
In summary, a website-controlled automatic microfluidic controlling platform is designed and fabricated for real-time microfluidic sensing and other applications. Solution manipulation using this platform is stable, repeatable, and time-saving compared with manual operation.