I’m an active person with strong learning abilities, being profoundly inspired by programming when I was young. In junior high school, I self-learned Visual Basic 6.0 for making simple programs and won first prize in science fair competition. In senior high school, I learned C language along with algorithms and data structures, and won 5th ~ 10th place in Taiwan Olympiad in Informatics. These series of events firmly established my outstanding programming skills.
In college, I majored in mechatronics and attained relevant skills for various applications. I teamed up with schoolmates for developing an alarm clock that can awake people using a specific fragrance and earned 40,000NTD in a fundraising event. During this period, I acquired PCB layout skills and the ability for practical usage of microcontrollers, IC chips and different electronic components. I have lots of practical experiences for machine learning and data mining using neural networks (Python + Tensorflow), and won first prize in a competition held by Taiwan Semiconductor Manufacturing Company (Big Data Analytics for Semiconductor Manufacturing). I also have experience in designing digital logic circuits using Verilog and Hspice, and obtained high scores in class.
My graduate research topic focuses on interdigitated array electrode chips applied to electrochemical impedimetric biosensing. I learned the complete microfabrication process for microelectrodes and microfluidic chips, utilized Raspberry Pi for developing a wireless and miniaturized website-controlled impedance detection device, and applied those to my own research. Accordingly, I wrote a full research article as first author, and published it on an international journal (Electrochimica Acta, IF = 5.383) (DOI: 10.1016/j.electacta.2019.134629). Now, I currently work as research assistant in my lab, and take the lead in research and development.
I have a great interest in playing puzzle and board games, where elaborate planning or problem solving strategy is a crucial part to succeed or win the game. After starting to learn programming since junior high school, I had written several programs that can compete with human players in a board game, solve a brain-twisting puzzle in less than one second, or play other difficult games by taking advantage of a computer’s computational speed. Here are some game-playing AIs that I had been working on.
This is an end semester project that I have done with my groupmates in college. In this study, we proposed a model to predict a startup company’s future condition using a deep multilayer perceptron (MLP) and decision tree. I mainly played the role for data quantification and literature review of this study. In our study, we built a prediction analysis model for startup companies. Furthermore, we identified what the key factors are and what influences will it have on the results. Our main hypothesis is that money, people and active days are the key factors. We built the prediction model from CrunchBase, which is the largest public database with relevant profiles about companies.
Data Quantification
For the data obtained, there are 4 groups of data that are quantified: country state, employee range, roles and countries. Regarding the states group (which only exists in USA and Canada), we think that different states have different impacts on the survival rate of a startup. A lookup table for scoring of states is defined [1][2][3]. The original data for employee quantities are a range between two numbers (e.g. 101-250). These are transformed into the average of the upper and lower bound. Employees of 10000+ are defined to be 15000. For the roles group, the data “company” is arbitrarily defined as 0.1 and “company, investor” is defined as 0.9. This is because we regard a company as wealthier and influential when it also plays a role of an investor, compared with only being a company. The other roles are transformed to 0.5. The impact of country on startup environment is also studied [4] and scores from 0.329 to 0.947 are given to countries that have above 300 startup companies in record.
Table 1. Company status and scores of 23 countries.
The ANN runs on a Windows 10 OS (i7-8700k CPU) with DDR4 2666MHz 16G RAM and Nvidia GTX 1070 Ti GPU. Keras is used to construct the network, and three networks of multilayer perceptron (MLP) with different number of layers are designed for comparison. There are 4 outputs of the network, indicating the probabilities of the final status which are: (1) Closed, (2) Operating, (3) Acquired and (4) IPO.
Figure 1. MLP Structure of the 3 neural networks.
The three networks have respectively 2, 4 and 6 hidden layers, with each network all starting with a 1024-neuron hidden layer and ending with a 32-neuron hidden layer (Fig. 1). Table 2 shows the training results.
Table 2. Mean square error (MSE) and categorical cross-entropy loss for the 3 networks.
Loss
Activation
Network 1
Network 2
Network 3
MSE
ReLU
0.695
0.694
0.689
MSE
sigmoid
0.690
0.690
0.691
MSE
linear
0.692
0.689
0.692
MSE
tanh
0.688
0.693
0.691
Cross-entropy loss
ReLU
0.695
0.691
0.690
Cross-entropy loss
sigmoid
0.692
0.691
0.691
Cross-entropy loss
linear
0.695
0.692
0.690
Cross-entropy loss
tanh
0.691
0.692
0.691
The results show that almost all results are close to 70% with few difference. In general, ReLU activation has a better result than sigmoid activation, while linear activation may outperform ReLU when the network is deep enough.
The neural network behaves like a black box. It is quite difficult to conclude significant insights just by looking at the trained parameters. However, regarding the importance for business, we used a decision tree to help us understand which factor is the most important and how important they are respectively.
Decision Tree Training
We tried three different depths of decision tree: 4 (Fig. 2), 6 (Fig. 3), and 10. We set the gain ratio to be the criterion, and the confidence to 0.1.
Figure 2. Decision tree of depth = 4.
Figure 3. Decision tree of depth = 6.
The results show that if a company is large enough to exceed 500 people, the close rates are low. In most cases, large companies are acquired by mergers and acquisitions. In addition to the number of employees, funding total amount also has a significant impact on whether a company eventually survives or closes.
Key Findings
Among the factors regarding the ability to survive of starting up companies, the factors such as the number of employees, funding total amount, and the active days have significant influences on the company’s survivability. On the contrary, the factors such as country, region or number of funding rounds do not have significant influences. Whether a company acts as an investor simultaneously will also have influences on whether the company will become an IPO or will be acquired.
Future Work
Our future work is expected to integrate the inspirative insight gained from our case study with the methodology of our own. Three items are listed as in the following:
Construct a heterogeneous relationship network for survival rate prediction [5].
Define a data path score according to HeteSim algorithm [6][7].
Predict company survival rate using MLP, decision tree and other neural networks.
Xiangxiang Zeng, You Li, Stephen C.H. Leung, Ziyu Lin, Xiangrong Liu, Investment behavior prediction in heterogeneous information network, Neurocomputing, Volume 217, 2016, Pages 125-132
Sun, Y., & Han, J. (2012). Mining Heterogeneous Information Networks: Principles and Methodologies. Synthesis Lectures on Data Mining and Knowledge Discovery, 3(2), 1-159
Shi, C., Kong, X., Huang, Y., Yu, P. S., & Wu, B. (2014). HeteSim: A General Framework for Relevance Measure in Heterogeneous Networks. IEEE Transactions on Knowledge and Data Engineering, 26(10), 2479-2492. [6702458].
This is a project which I and my classmates had finished in a course focusing on practical implementation for mechatronics and system design, and is a sequel of the previous Aroma Alarm Clock project. We designed an Android app-controllable alarm clock which can heat up objects such as a water-filled container, and intend to further improve it for making coffee, so that one can enjoy a fresh cup of coffee in the morning after awakening. Similar to the previous one, I worked as the engineer in our group, and designed and constructed the hardware system.
System Framework
Fig. 1 shows the overall system architecture, which several electronic components (e.g. clock module, LCD display…) are controlled by a microcontroller that can communicate with a mobile application using a Bluetooth module. The alarm clock can be controlled either using its own hardware input (buttons) or using the mobile app. Simply put, the system has same the functions as a typical alarm clock, but has two additional features:
1. Temperature controllable heater. 2. Bluetooth communication.
Figure 1. System architecture for the coffee maker alarm.
Hardware
Arduino Uno, DS1302 chip, HC-06 and LCD1602 are used respectively for the microcontroller, real-time clock module, Bluetooth module and LCD display module. Being an end-semester project in class, the components are simply connected using a breadboard. All the hardware components except the heater are packed using patterned cardboard in a simply looking fashion (Fig. 2).
Figure 2. Hardware appearance of the coffee maker alarm.
A ceramic heater plate and temperature sensor are integrated for realizing temperature controlling (Fig. 3), and are connected out from the main hardware. The total cost for all the components is 1,741 NTD (≅ 60 USD).
Figure 3. Heater and temperature sensor.
Software
App Inventor 2 is used as the platform for creating the Android app for controlling the hardware. Fig. 4 displays the designing interface for the mobile app using the platform.
Figure 4. Design interface using App Inventor 2.
The coding section for this platform is very unique and easy to get started. It implements a block-based programming method which developers can create procedure by dragging pre-defined blocks together to for performing a certain function. Developers with no programming background can use this kind of environment for creating mobile apps. Fig. 5 shows a gallery containing the complete code for the alarm clock controlling app.
Figure 5. Gallery of block codes for the alarm clock app.
Here’s a video demonstration for using this system:
I acquired my first forex bank account for attending an international conference in 2018. Lacking the basic concepts for fundamental and technical analysis, I came up with a simple but profound idea: Would it be possible to construct a system that can automatically trade forex and profit from it? Thus started this project of automated forex trading.
System Framework
Fig. 1 illustrates the overall system architecture. Here, the main server is used to autonomously access online forex data, save it into a table, and perform all necessary calculations for generating a trade signal (e.g. buy, sell, do nothing). A trading model is loaded inside the main server, and can be any form of structure as long as it can input history and current forex data and output a trade signal. A client can train the trading model on a remote server, then manually update it on the main server. The trade signal is sent to another server specialized for interacting with an online trading platform.
Figure 1. System architecture of this project.
This architecture has the advantage for clearly distinguishing the functional blocks, where each block can be modified separately. For example, if one plans to implement a trading strategy that utilizes machine learning for prediction of future prices, he/she can pre-train the model beforehand, update the model to the main server, and needn’t worry about system failure as long as the input and output of the trading model corresponds to what the main server requires.
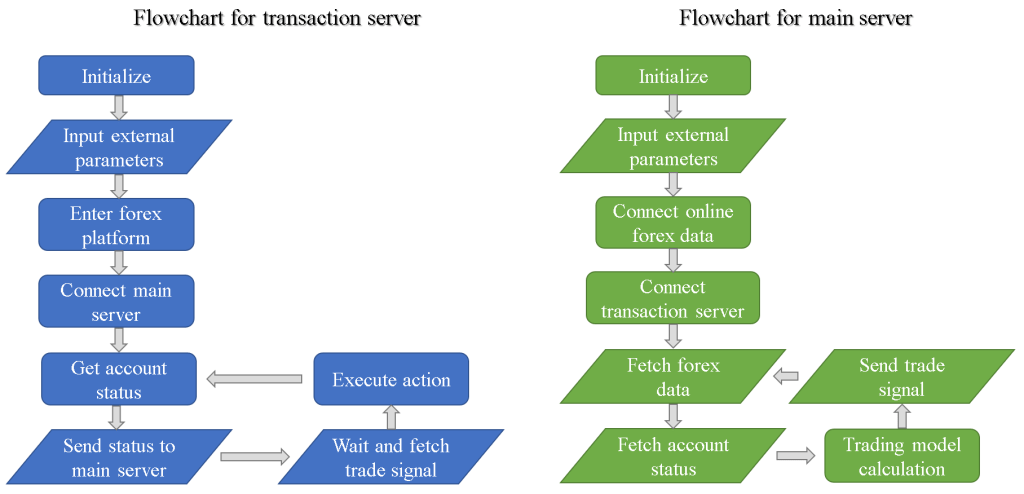
Fig. 2 details the flowchart for the main and transaction server. The servers initialize, connect with each other and other online resources, and enter the main loop for autonomous trading. The main server runs on a Linux-based operating system, where Python is used as the language for the main program. By constructing a database and querying with MySQL, per-minute forex data can be stored structurally. For the transaction server, Python is also used for the main program, and Selenium is used for web control automation. The two servers communicated using SSH protocol.
Figure 2. Program flowchart for transaction and main server.
Trading Strategy
In this project, a simple strategy for trading is implemented for verification of the effectiveness of automated trading (see another project <reinforcement learning assisted forex trading> for in-depth investigation on trading strategies):
1. The account initially buys a currency pair at a random point. 2. If the rate increases and reach the take profit value, sell it. 3. If the rate decreases and drops below a defined value, buy twice the previous amount.
Figure 3. Trading strategy used in this project.
As long as the rate reaches the take profit point within the period of a trade, this strategy will always be profitable (though in reality this strategy has several disadvantages and runs at the risk of a stop out due to the absence of a stop loss). By using this strategy, the system can be tested of functionality since it requires every functional block to work properly.
Trading Results on Real Account
After testing a few times on a demo account, I decided to use a real account so that I can obtain practical experience being a real game player, and also be stimulated for all the amount I had invested. The initial balance is set as 500 USD ($) to give me enough capital to test this system, but not too much for losing all hope if I ever get stopped out (Fortunately, this never happened.).
The detailed trading results using a real account between 2018/05/04 and 2019/03/12 can be downloaded here. The major currency pairs are used, and a multiplier of 50 (or leverage of 2%) is used to magnify the trade profit and loss. Table 1 and 2 summarize the overall results.
Table 1. Currency pairs used for trading and their corresponding trade count.
Currency Pair
Trades
EUR/USD
99
NZD/USD
60
AUD/USD
75
GBP/USD
86
USD/JPY
66
USD/CHF
28
USD/CAD
52
Total
466
Table 2. Summary for real account trading using the automated system.
Start Time Point
Apr 5 2018 11:05
End Time Point
Mar 12 2019 8:52
Total Trade Amount ($)
17074
Total Received Amount ($)
17234.26
Total Profit ($)
160.26
Average Profit per Trade ($)
0.344
Fig. 4 shows the account balance and profit during the whole period. For the first 396 trades, the balance rises in a slow and steady manner. The 397th trade, which is the trade resulting in a sharp decline of balance, is actually manually closed by myself due to reason that it got stuck in a losing position for too long. I had to close it myself so for maintaining enough equity to keep trading. This clearly demonstrates the disadvantage of the trading strategy I had used. From the 398th to the 597th trade, I increased the buy amount so that a larger change in balance (either gain or loss) is exhibited. At last, the balance arrives at 660.26$ and a total profit of 160.26$ is acquired.
Figure 4. Balance and profit vs trade count (the i-th trade).
Summary
In summary, an automated forex trading system is developed and has several features including automatic transaction, forex history data storage, real-time data acquisition and trading model implementation. This system is comparable with another electronic trading platform MetaTrader, however still lacking several other features such as visualization of forex data or economic calendar analysis. I am planning to integrate this system with another project <reinforcement learning assisted forex trading> for optimizing the trading strategy.
This study serves as a major extension for my previous research Impedimetric Microfluidic Chip for MUC1 Aptasensing. Similar to the previous one, microfluidic chips are fabricated for impedimetric detection of tumor marker MUC1. Moreover, I integrated an interdigitated array electrode (IDA electrode) into the chip, and realized real-time detection for the aptasensor. In-depth investigation of the relationship between electrochemical properties and microfluidic conditions are also carried out. This system possesses several advantages, such as the highly sensitive characteristic of IDA electrodes, real-time detection, low sample usage, label-free detection using EIS, and miniaturized volume using a microfluidic chip.
Introduction
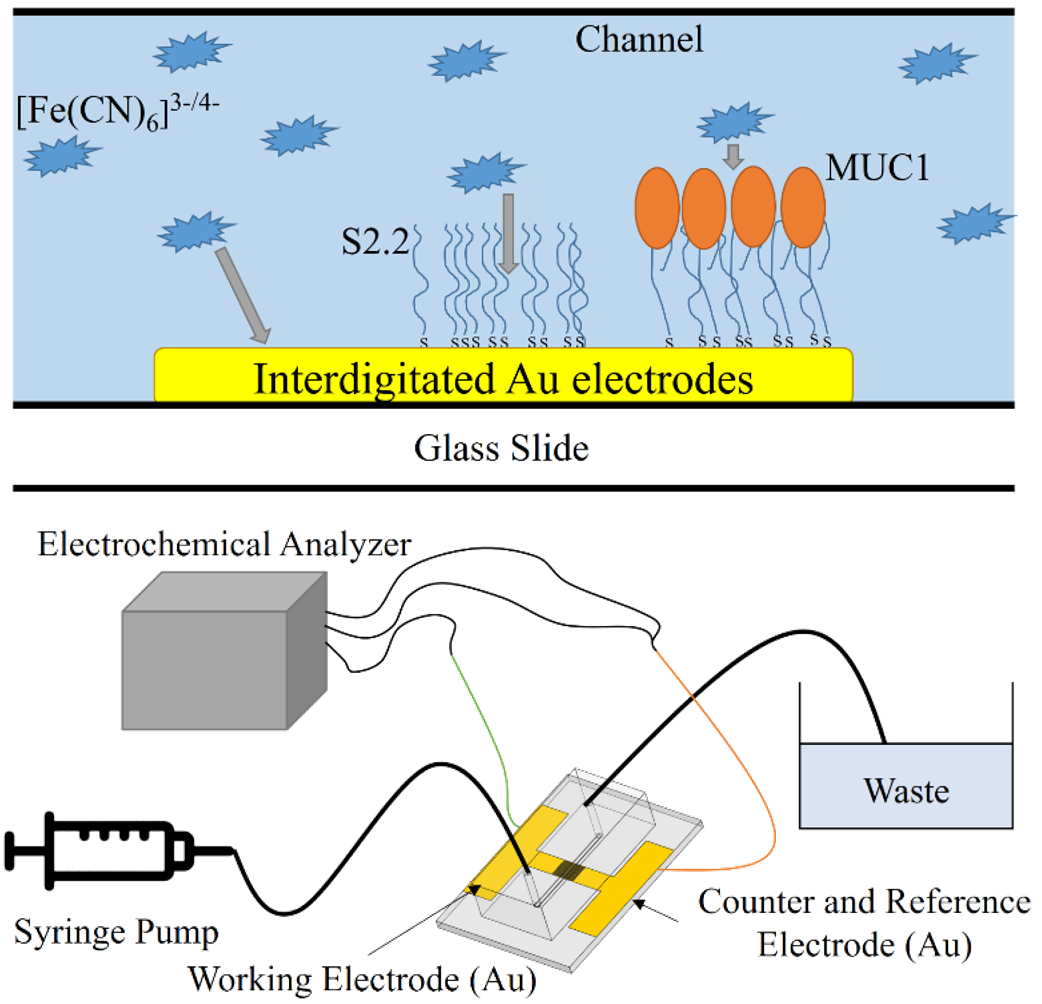
MUC1 is a surface glycoprotein which over-expresses in several types of cancer cells, making it an ideal marker for cancer detection. For MUC1 recognition, the S2.2 aptamer is a 25mer ssDNA selected in vitro and can affinitively and specifically bind to certain motifs within the MUC1 protein. Electrochemical impedance spectroscopy (EIS) has been proven as an effective method for ultrasensitive MUC1 aptasensing and cell detection [1]. Despite the high sensitivity and selectivity of EIS and the S2.2 aptamer, long reaction times and large sample volumes have hindered EIS biosensors for realistic bioanalysis.
The integration of microfluidics with EIS has a large potential for lowering the amount of usage during reactions and to meet real-time, portable, large-scale and high-throughput requirements. Though up to date, there hasn’t yet been studies regarding real-time impedimetric aptasensing to the best of our knowledge. Thus, this research is dedicated to develop a real-time microfluidic impedance aptasensing platform for affinitive and selective detection of MUC1.
Related Publications
C.-Y. Lai, J.-H. Weng, L.-C. Chen, Real-time impedimetric MUC1 aptasensor using microfluidic symmetric Au electrodes, The Twenty Second International Conference on Miniaturized Systems for Chemistry and Life Sciences (µTAS), (2018). [poster pdf]
J.-H. Weng, C.-Y. Lai, L.-C. Chen, Microfluidic amperometry with two symmetric Au microelectrodes under one-way and shuttle flow conditions, Electrochimica Acta, 297 (2019) 118-128. https://doi.org/10.1016/j.electacta.2018.11.128
This is the research topic for my master’s thesis, which serves as an integrated work for the related researches and projects that I have worked on. Relevant studies have been accepted as 4 journal papers (1st author x2, co-author x2) and 5 international conference papers (1st author x4, co-author x1). The list below shows all the related topics covered in my thesis:
The inhibition of tumor markers has been a popular research object among the academic society. They are often detected using simple and low-cost techniques such as electrochemical impedance spectroscopy (EIS), which aptamers are occasionally used as the sensing element for achieving high sensitivity and selectivity. This integrated method has flourished in recent years.
However, for electrochemical methods, a three electrode setup faces fabrication complexity, high cost and low yield rates during miniaturization. Two electrode impedimetric detection using interdigitated array (IDA) electrodes also faces a problem. Due to its geometry, there hasn’t been any studies that derive its diffusion impedance according to different bandwidths and gap widths. Therefore, this study makes a basis on impedimetric modeling of symmetric two electrode systems.
The first part focuses on the derivation and verification of an integral form of solution for IDA diffusion impedance. An equivalent circuit fitting program succeeded to accurately fit the EIS data and parameters such as the ratio of electrode bandwidth to gap width and diffusion coefficient can also be obtained by fitting the data from a single EIS experiment. This can aid researchers in relevant fields model their systems more accurately.
In the second part, a symmetric equivalent circuit model is developed, and it is applied it for impedimetric detection of thrombin and a tumor marker MUC1 with a fabricated aptasensor using standard Au electrodes (SGE) and IDA chips. The model is proved of correctness, and is applied for bio-detection. IDA chips are used for aptasensor fabrication for thrombin detection. The program designed in the first part is used for circuit fitting of EIS data, and accurate parameters are obtained. This sensor has the regenerability for six times of detection and the specificity is also confirmed.
Symmetric Au electrode systems have simple and low fabrication cost characteristics. Its integration with highly stable aptamers can contribute to mass production and customization in product commercialization. According to the above results, the author anticipates future developments in relevant medical diagnosis and point-of-care applications.
Related Publications
(Upcoming conference with paper accepted) C.-Y. Lai, T.-H. He, W.-C. Huang, L.-C. Chen, MUC1 impedimetric aptasensing based on interdigitated array electrode chip using a novel diffusion element, 30th Anniversary World Congress on Biosensors, (2020).
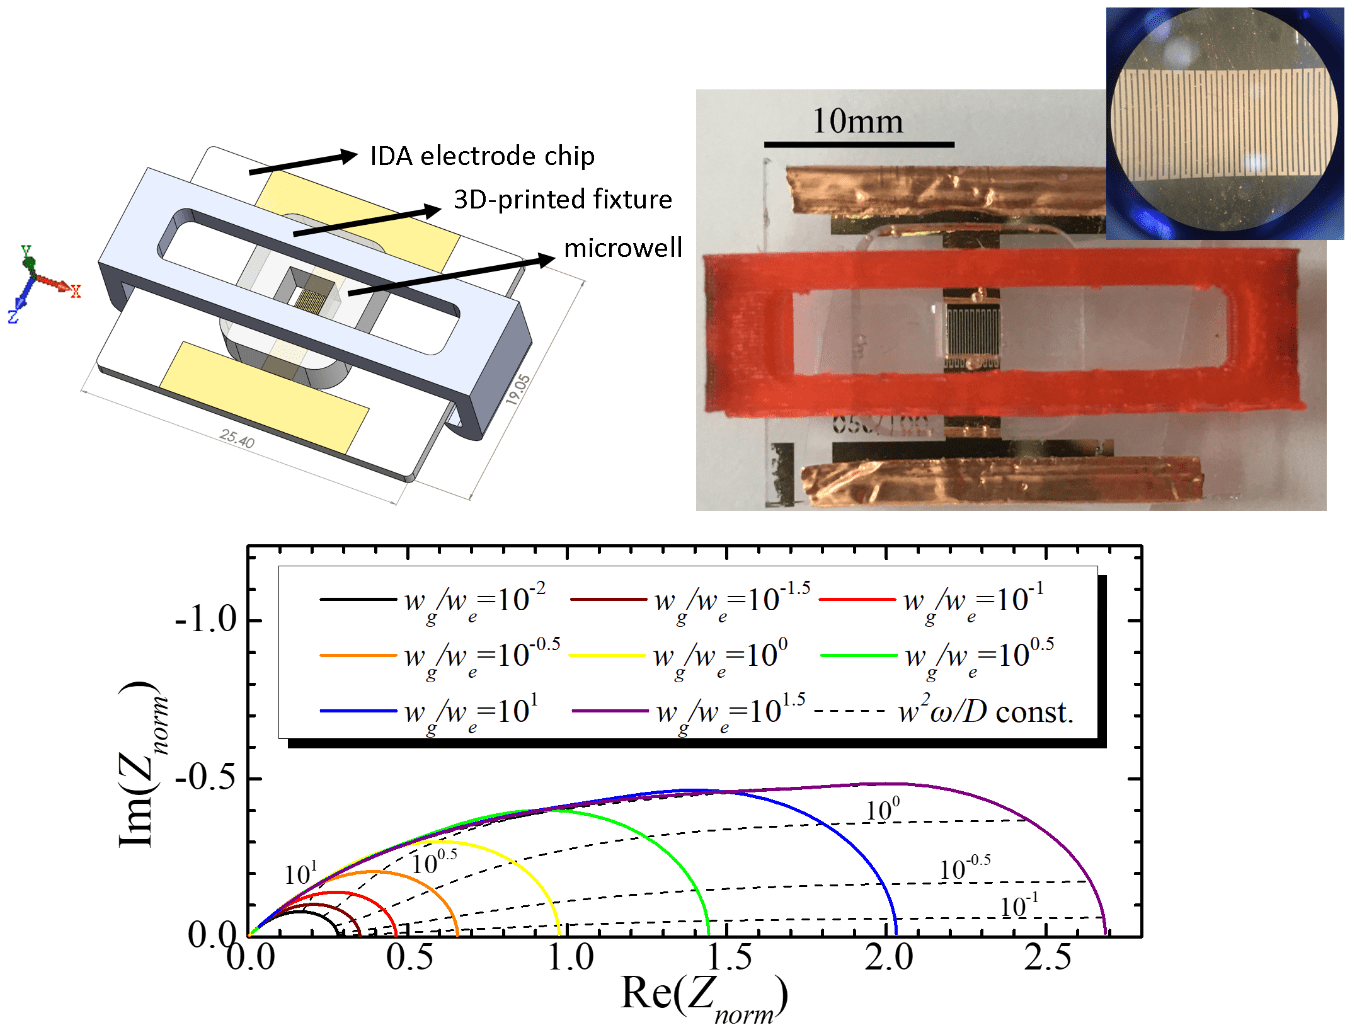
While I was working with interdigitated array electrodes (IDA electrodes) for my previous research Real-time Impedimetric MUC1 Aptasensor using Microfluidic Symmetric Gold Electrode, I discovered a major problem with its impedance spectrum when viewing the Nyquist plot. Until then, there hadn’t been any studies that can explain the diffusion phenomenon of redox species between the band electrodes due to an applied sinusoidal voltage wave, and no circuit elements appear to be suitable for modeling the diffusion impedance of IDA electrodes. Therefore, I devised a theory for modeling an IDA electrodes impedimetric properties using conformal mapping and cylindrical finite length approximation methods, and succeeded to construct a circuit element that can replace the Warburg element, and extract important parameters from the corresponding equivalent circuit model. This can aid researchers in relevant fields to model their systems more accurately.
Here’s a video for visualizing the diffusion phenomenon between the band electrodes of an IDA electrode. COMSOL is used for simulating the time-dependent concentration field of redox species.
Abstract
An analytical problem for impedimetric sensing is usually encountered when using interdigitated array (IDA) electrodes. Finite diffusion of redox species dominates at low frequencies and confuses researchers, making incorrect understanding of underlying phenomena possible. In this work, an integral equation for calculating the diffusion impedance of IDA electrodes is derived using conformal mapping and cylindrical finite length approximation. Electrodes of different bandwidths and gap widths are fabricated, and their heights and symmetric electrochemical characteristics are verified. Simulations are performed to verify the predicted constant concentration contours. The calculated zero-frequency impedance showed high correlation with the reciprocal of limiting current calculated from literature study (R2 = 0.992) and from chronoamperometry experiments (R2 = 0.970). Further evidence for the correctness of theory is established due to the fact that experimental EIS data and calculated impedances are highly consistent (R2 ≥ 0.948 for real and imaginary part). This sheds some light on explaining the diffusion phenomenon of impedance using IDA electrodes in the low frequency spectrum. An equivalent circuit fitting program is further designed for fitting several elements including the IDA electrode diffusion impedance derived in the theory. The program succeeded to accurately fit the EIS data (average MSE = 0.611), which using the Warburg element failed (average MSE = 54.86). Parameters such as the ratio of electrode bandwidth to gap width and diffusion coefficient can also be determined by fitting the data from a single EIS experiment. Another impedance calculation program is also given, which can aid researchers in relevant fields to model their systems more accurately.
This is the research topic for my bachelor’s thesis. After completing the Surface Plasmon Resonance Platform project, I acquired microfabrication techniques for fabricating microfluidic gold surface chips. The gold surface can be patterned to form a two-electrode setup, where electrochemical detection can be applied for biosensing. For this project, I fabricated a microfluidic microelectrode chip that can detect the concentration of the tumor marker MUC1 using a DNA aptamer. A method called electrochemical impedance spectroscopy (EIS) is used for detecting the change of impedance caused by different concentrations of MUC1. I won the Outstanding Poster Award for poster presentation of this work at the 64thTwIChE (Taiwan Institute of Chemical Engineers) Annual Meeting.
Introduction
Mucin 1(MUC1) is a glycoprotein which plays an important role within the human body such as cell signaling and defense of pathogens. Overexpression of MUC1 on cancer cell surfaces promotes cell survival and tumor angiogenesis. Therefore, the detection of MUC1 has become a new trend in early detection of cancer and therapy. Aptamers are synthesized DNA or RNA which serves as suitable sensing elements for targets such as MUC1 or other proteins and can achieve excellent affinity and selectivity. Electrochemical impedance spectroscopy (EIS) is a powerful electrochemical detection technique regarding its ability for monitoring different stages during the fabrication process of aptasensors. Moreover, the label-free, simple and highly sensitive features further strengthen its potential of integrating with other applications. Microfluidics are recently recognized as a technique advantageous for performing bioanalysis. Not only can they lower the amount of usage during reactions, but also have the potential to meet real-time, portable, large-scale and high-throughput requirements. In this study, a novel aptasensor for detecting MUC1 using microfluidic integrated gold electrode is fabricated and demonstrated. Parameter fitting of the equivalent circuit is performed after each step during the fabrication and protein detection. An LOD of 0.42nM is achieved and the fitting result suggests several varying element parameters influenced by the concentration of MUC1. The simple, label-free and low reagent usage detection of MUC1 using this microfluidic impedimetric aptasensor is achieved.
Related Publications
C.-Y. Lai, L.-C. Chen, The study of an impedimetric microfluidic chip design for mucin1 aptasensing, 64th TwIChE Annual Meeting, (2017). Outstanding Poster Award [poster pdf]
C.-Y. Lai, L.-C. Chen, Detection of mucin1 with a microfluidic impedimetric aptasensor, International Symposium on Smart-Sensing Medical Devices and 22nd Symposium of Association for Chemical Sensors in Taiwan, (2017). [abstract] [presentation pdf] [presentation clip]
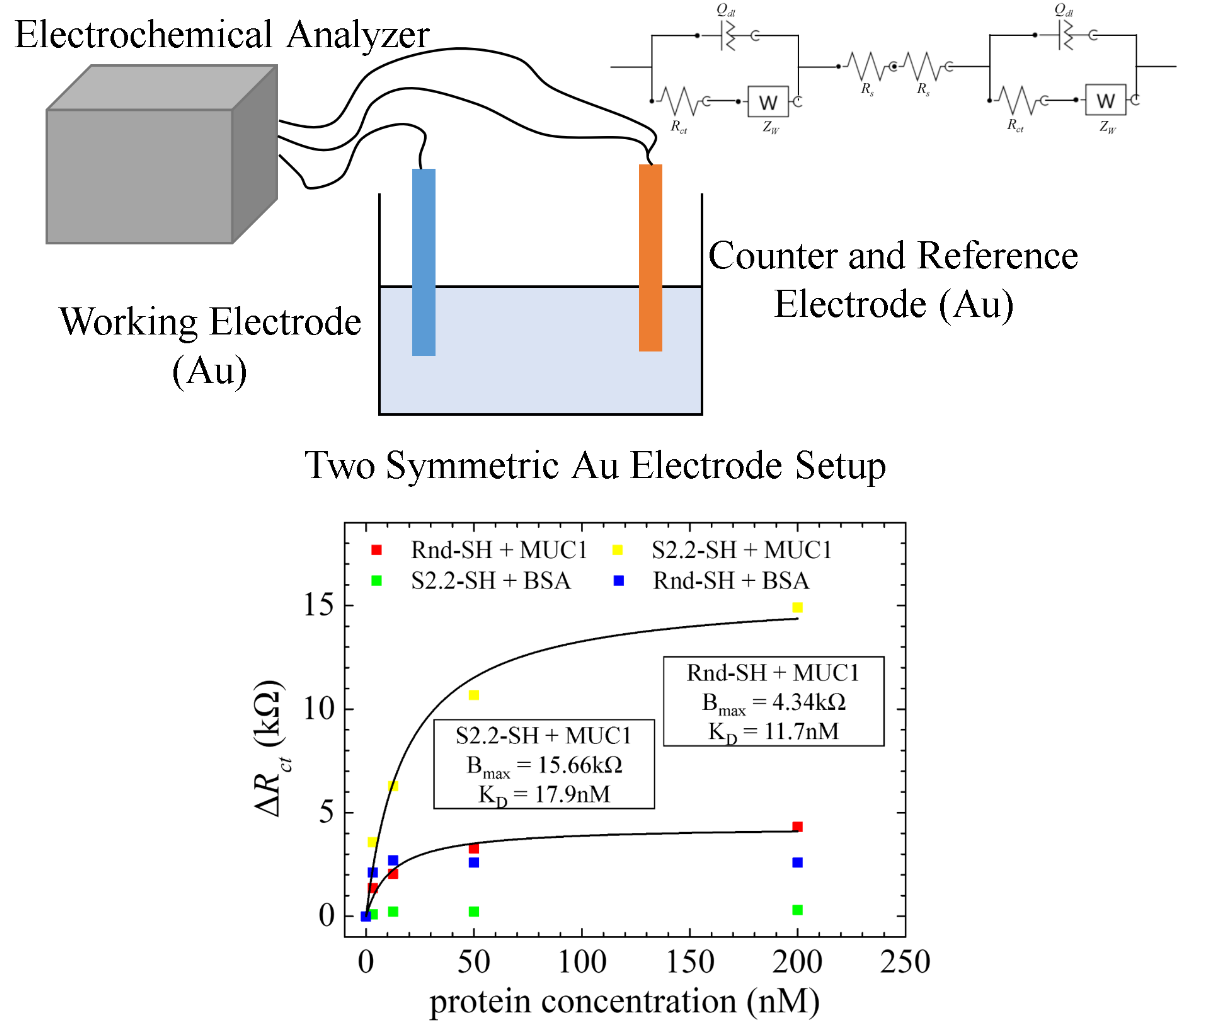
In most of my studies, a symmetric electrode setup is implemented for impedimetric biosensing. However, most literatures still apply the analytical methods of three-electrode setups on these kinds of setups. Even though relationships between fitted parameters and the analyte concentration can still be found, the underlying physical properties might be wrong due to model misuse. In this study, I derived a theoretical model for characterizing impedance data using a novel equivalent circuit for symmetric electrode setups. The corresponding physical properties are proven correct by using this model instead of others. Moreover, the model is implemented for calculating important physical parameters for tumor markeraptasensing using symmetric electrode setups. This study can assist researchers to relate the fitted and true values of important impedimetric parameters.
Abstract
Electrochemical impedance spectroscopy (EIS) applied for aptasensing is being extensively studied for a variety of targets. Substitution of a symmetric electrode configuration for a conventional three-electrode setup on EIS aptasensing is becoming a trend due to its simple and favorable characteristics for biochip fabrication. However, a single Randles circuit is often used for impedance element parameter fitting in symmetric electrode aptasensing without rationalized basis of validity to date. In this work, an AC impedance model is derived for proving the validity of simplifying a symmetric Randles circuits in series into a single one and is examined with aptasensing applications. With the model, circuit parameter relationships can be quantified and correlated between symmetric and three-electrode configurations. The relationships are verified by comparing the fitted parameters obtained from standard gold electrodes (SGEs), microfabricated symmetric Au electrodes, and interdigitated array (IDA) Au electrode chips with different surface and detection conditions. The model is then found valid for different redox species composition (either Fe(CN)63- or Fe(CN)63-/4- is used) and for both blank and aptamer modified surfaces. From aptasensing of thrombin and tumor marker mucin 1 (MUC1), it is proved that the measured dissociation constants (KD: 129.4 nM for thrombin and 16.3 nM for MUC1) remain the same between a symmetric and three-electrode configuration, but the maximum change of charge transfer resistance (Bmax) is doubled in the symmetric one. This means that the symmetric configuration not only yields the same KD, but also results in a doubled binding signal for EIS aptasensing. In addition to the model derivation and experimental validation, specific EIS aptasensing of MUC1 using a symmetric electrode configuration is successfully demonstrated in this work.
C.-Y. Lai, L.-C. Chen, EIS detection of MUC1 with two symmetric aptamer/Au electrodes, 22nd Topical Meeting of the International Society of Electrochemistry, (2018). [abstract] [presentation pdf] [presentation clip]
It is already well-known that in 2016, the computer program AlphaGo became the first Go AI to beat a world champion Go player in a five-game match. AlphaGo utilizes a combination of reinforcement learning and Monte Carlo tree search algorithm, enabling it to play against itself and for self-training. This no doubt inspired numerous people around the world, including me. After constructing the automated forex trading system, I decided to implement reinforcement learning for the trading model and acquire real-time self-adaptive ability to the forex environment.
Environment Setup
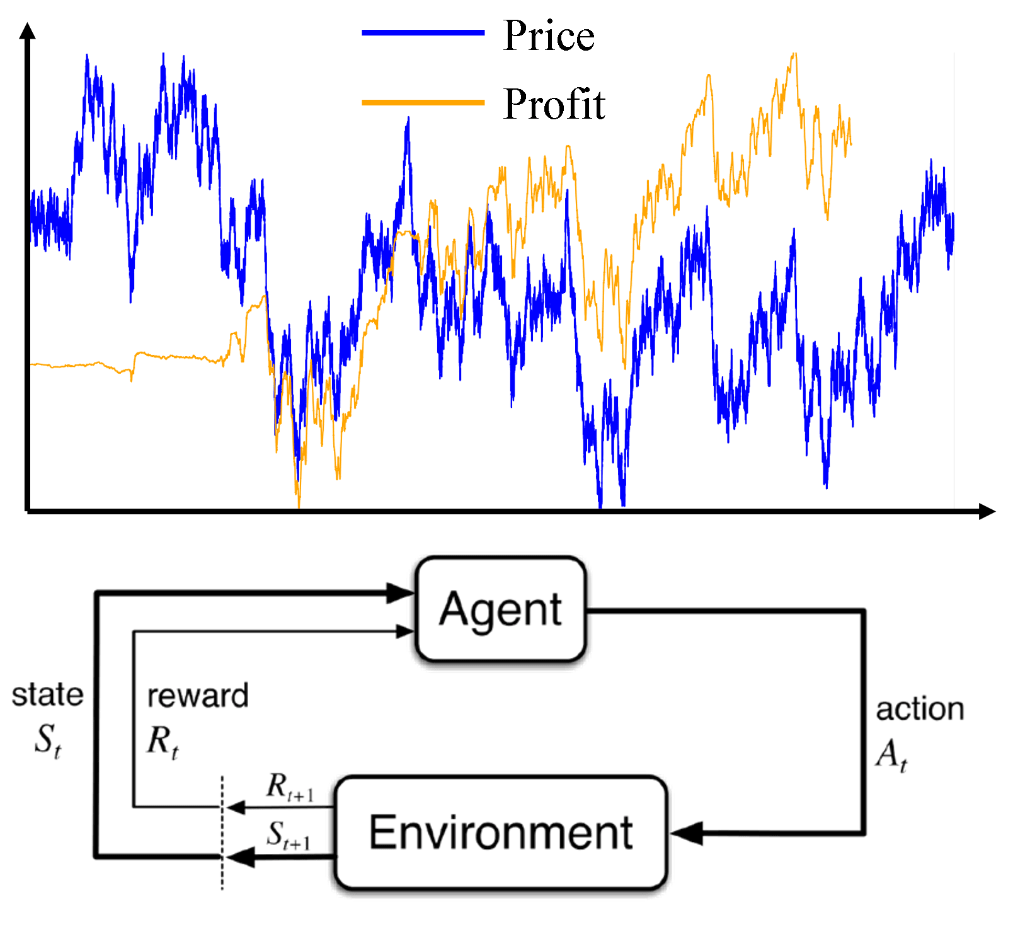
The model runs on a Windows 10 OS (i9-9900K CPU) with DDR4 2666MHz 16G RAM and NVIDIA GeForce RTX 2060 GPU. Tensorflow is used for constructing the artificial neural network (ANN), and a multilayer perceptron (MLP) is used. The code is modified from the Frozen-Lake example of reinforcement learning using Q-Networks. The model training process follows the Q-learning algorithm (off-policy TD control), which is illustrated in Fig. 1.
Figure 1. Algorithm for Q-learning and the agent-environment interaction in a Markov decision process (MDP) [1].
For each step, the agent first observes the current state, feeds the state values into the MLP and outputs an action that is estimated to attain the highest reward, performs that action on the environment, and fetches the true reward for correcting its parameters. The agent follows the epsilon-greedy policy (ε = 0.1) for striking a balance between exploration and exploitation.
State, Action and Reward
For the 1st generation, price values at certain time points and technical indicators are used for constructing the states. The technical indicators used are the exponential moving average (EMA) and Bollinger bands (N=20, k=2), and time frames of 1, 5 and 15min are used with the last 10 time points being recorded. A total number of 36 inputs are connected to the MLP.
There are three action values for the agent: buy, sell and do nothing. The action being taken by the agent is determined by the corresponding three outputs of the MLP, where sigmoid activation functions are used for mapping the outputs to a value range of 0 ~ 1, representing the probability of the agent taking that action.
For the reward function, the difference between the trade price (the price when a buy/sell action is taken) and the averaged future price is considered. If a buy action is taken, then the reward function is calculated by subtracting the averaged future price with the trade price; if a sell action is taken then the reward is calculated the other way around. For “do nothing” actions, the reward is 0. A spread is subtracted from the reward for buy/sell actions to obtain the final reward. This prevents the agent to perform actions that result in insignificant profit, which would likely lead to a loss for real trades (Fig. 2).
Figure 2. Reward calculation method for buy/sell actions.
Noisy Sine Function Test
For preliminary verification of effectiveness for the training model and methods, a noisy sine wave is generated with Brownian motion of offset and distortion in frequency. This means at a certain time point (min), the price is determined by the following equation:
where Pbias is an offset value with Brownian motion, Pamp is the price vibration amplitude, T is the period with fluctuating values, and Pnoise is the noise of the price with randomly generated values. (Note that the “price” mentioned here is defined as the exchange rate between two currencies)
Fig. 3 shows a randomly generated price vs time sequence within a range of 50,000 minutes with an initial values Pbias = 1.0, T = 120 min, Pamp = 0.005, and Pnoise amplitude = 0.001. Generally, the price seems to fluctuate randomly with no obvious highs or lows. However, if it is viewed close-up, waves with clear highs and lows can be observed (Fig. 4).
Figure 3. Price vs time of the noisy sine wave from 0 to 50,000 min.
Figure 4. Price vs time of the noisy sine wave from 20000 to 20600 min.
The whole time period is 1,000,000 min (approximately 700 days, or 2 years). Initially, a random time period is set for the environment. Every time the agent takes an action, there is a certain chance (= 1%) that the time will jump to another random point within the whole period. Otherwise, the time will move on to a random point which is around 1 ~ 2 day(s) in the future. This setting is expected to correspond to real conditions, where a profitable strategy can have stable earnings and can also adapt quickly to rapid changing environments.
Fig. 5 plots the cumulative profit for trading using the noisy sine wave signal for 50,000 steps. Although it took approximately 25,000 steps to make the model get “on track”, I recognize this result as an important start for implementing real data.
Figure 5. Cumulative profit from trading using a noisy sine wave signal.
Fundamental Analysis for Economic Events
Fundamental analysis is a tricky part in forex trading, since economic events not only correlate with each other, but also might have opposite effects on the price at different conditions. In this project, I extracted the events that are considered significant, and contain previous, forecast and actual values for analysis. Data from 14 countries of the past 10 years are downloaded and columns with incomplete values are abandoned, making a complete table of economic events.
Because different events have different impacts on forex, the price change after the occurrence of an event is monitored, and a correlation between each event and the seven major pairs (commodity pairs). Table 1 displays a portion of the correlation table for different economic events. The values are positive, which indicates the significance of an event on the currency pair. Here, a pair is denoted by the currency other than the USD (e.g. USD/JPY is denoted as JPY).
Table 1. Correlation table between 14 events and 5 currency pairs. Here, a pair is abbreviated as the currency other than the USD.
Country
Economic Event (Index)
AUD
CAD
EUR
GBP
JPY
AUD
Commodity Prices
0.00313
0.00268
0.00266
0.00339
0.00278
AUD
MI Inflation Expectations
0.00338
0.00168
0.00217
0.00200
0.00266
AUD
RBA Interest Rate Decision
0.00428
0.00262
0.00258
0.00298
0.00225
EUR
Manufacturing PMI
0.00331
0.00284
0.00263
0.00298
0.00278
EUR
Italian CPI
0.00315
0.00319
0.00295
0.00316
0.00255
EUR
Services PMI
0.00341
0.00290
0.00293
0.00295
0.00284
EUR
CPI
0.00304
0.00294
0.00262
0.00317
0.00241
EUR
German Unemployment Rate
0.00315
0.00315
0.00273
0.00313
0.00246
EUR
ECB President Trichet Speaks
0.00344
0.00248
0.00341
0.00302
0.00268
EUR
German Unemployment Change
0.00313
0.00313
0.00268
0.00307
0.00243
EUR
German Trade Balance
0.00306
0.00255
0.00300
0.00284
0.00268
EUR
German Factory Orders
0.00292
0.00265
0.00312
0.00280
0.00275
EUR
German Retail Sales
0.00304
0.00304
0.00353
0.00310
0.00275
EUR
French Trade Balance
0.00312
0.00312
0.00296
0.00301
0.00299
A total of 983 events are analyzed. However, due to the fact that a large portion of events have little influence on the price, only 125 events that have a relatively significant impact are selected as the inputs of the MLP.
Real Data Implementation Results
Per-minute exchange rate data of the seven currency pair is downloaded from histdata.com. A period from 2010 to 2019 is extracted, and blank values are filled by interpolation. This gives us a total of approximately 23 million records of price data (note that weekends have no forex data records), and is deemed sufficient for model training. The data is integrated into a table, and technical indices are calculated using ta, a technical analysis library for Python built on Pandas and Numpy.
Figure 6. EUR/USD exchange rate from 2010 to 2019.
Summing the inputs from technical analysis, fundamental analysis, and pure price data, a total of 1049 inputs are fed into the MLP. Within the hidden layers, ReLU activation is used, and a sigmoid activation function is used for the output layer. The output has a shape of 7×3, which represents the probability of the seven currency pairs and the three actions (buy, sell, do nothing).
Fig. 7 shows the accumulative profit from 2,000,000 steps in a single episode and its win rate (percentage of profitable trades within a moving average). An increasing spread value from 0.00001 to 0.00004 is applied, which the spread value starts from 0.00001 and increases by 0.00001 every 50,000 step. It can be seen that overall, the accumulative profit rises steadily. However, the win rate usually falls below the 50% line. How could a profitable trading strategy be possible? This is due to the fact that the average profit of a winning trade (=0.003736) is larger than the average loss of a losing trade (=0.003581). Thus, the overall result is a profitable trading strategy.
Figure 7. Accumulative profit and win rate from the training procedure of 2,000,000 steps.
Conclusion
In conclusion, a trading model for profitable forex trading is developed using reinforcement learning. The model can automatically adapt to dynamic environments to maximize its profits. Although for real conditions that have a larger spread, the model hasn’t achieved a stable and profitable result, the potential for optimizing is promising. In the future, I am planning to integrate this trading model with the automated forex trading system that I have made, and become a competitive player in this fascinating game of forex.